10 results for wolmar

Review of the year: 2014

Once again I look back on a year of blogging. You can see what I’ve been up to on the index page of this blog.

I get the feeling that my blog is just for me and a few students trying to fake having done their set reading. I regularly use my blog to remember how to fix my Ubuntu installation, and to help me remember what I’ve read.

A couple of posts this year broke that pattern.

Of Matlab and Python compared the older, proprietary way of doing scientific computing with Matlab to the rapidly growing, now mature, alternative of the Python ecosystem. I’ve used Matlab for 15 years or so as a scientist. At my new job, which is more open source and software developer oriented, I use Python. My blog post struck a cord with those burnt by licensing issues with Matlab. Basically, with Matlab you pay for a core license and then pay for toolboxes which add functionality (and sometimes you only use a small part of that functionality). It’s even more painful if you are managing networked licenses serving users across the world.

My second blog post with a larger readership was Feminism. This started with the unprofessional attire choice of a scientist on the Rosetta/Philae comet landing mission but turned into a wider, somewhat confessional post on feminism. In a nutshell: women routinely experience abuse and threat of which I believe men are almost entirely oblivious. 

As before my blogging energies have been split between my own blog here, and the ScraperWiki blog. My personal blogging is dominated by book reviews these days as, to be honest, is my blogging at ScraperWiki. I blog about data science books on the ScraperWiki blog  – typically books about software – and anything else on this blog. “Anything else” is usually broadly related to the history of science and technology.

This year has been quite eclectic. I read about the precursors to Darwin and his theory of evolution, macroeconomics, the Bell Laboratories, railways, parenthood, technology in society, finding the longitude (twice), Lord Kelvin, ballooning, Pompeii and I’ve just finished a book on Nevil Maskelyne – Astronomer Royal in the second half of the 18th century. I think my favourite of these was Finding Longitude by Richard Dunn and Rebekah Higgitt not only is the content well written but it is beautifully presented.

Over on the ScraperWiki blog I reviewed a further 12 books, bingeing on graph theory and data mining. My favourites from the "work" set were Matthew A. Russell’s Mining the Social Web and Seven Databases in Seven Weeks. Mining the Social Web because it introduces a bunch of machine learning algorithms around interesting social data, and the examples are supplied as IPython notebooks run in a virtual machine. Seven Databases is different – it gives a whistle stop tour of various types of database but manages to give deep coverage quite quickly.

I continue to read a lot whilst not doing a huge amount of programming – as I observed last year. I did write a large chunk of the API to the EU NewsReader project we’re working on which involved me learning SPARQL – a query language for the semantic web. Obviously to learn SPARQL I read a book, Learning SPARQL, I also had some help from colleagues on the project.

I had a lot of fun visualising the traffic and history of the London Underground, I did a second visualisation post on whether to walk between Underground stations in London.

Back on this blog I did some writing about technology, talking about my favourite text editor (Sublime Text), my experiences with Apple, Ubuntu and Windows operating systems, the dinky Asus T100 Transformer laptop, and replacing my hard drive with an SSD (much easier than I thought it would be). The Asus is sadly unused it just doesn’t serve a useful purpose beside my tablet and ultrabook format laptop. The SSD drive is a revelation, it just makes everything feel quicker.

The telescope has been in the loft for much of the last year but I did a blog post on the Messier objects – nebulae and so forth, and I actually took an acceptable photo of the Orion nebula although this went unblogged.

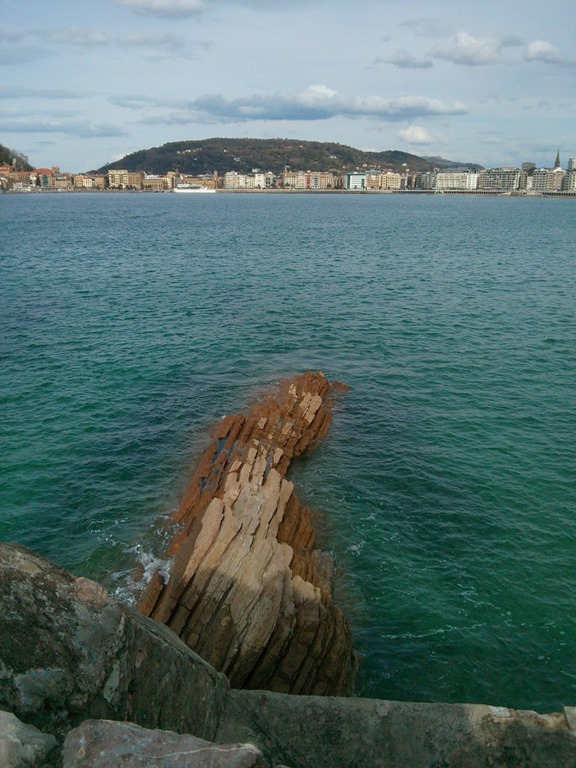
Finally, the source of the photo at the top of the page, I visited San Sebastian for an EU project I’m working on. I only had my phone so the pictures aren’t that good.

Happy New Year!

Book review: The Shock of the Old by David Edgerton
shock_of_the_oldThe Shock of the Old by David Edgerton is a history of technology in the 20th century.

A central motivation of the book is that, according to the author, other histories of technology are wrong in that they focus overly on the dates and places of invention and pay little attention to the subsequent dissemination and use of technologies.

The book is divided thematically covering significance, time, production, maintenance, nations, war, killing and invention. Significance reports on the quantitative, economic significance of a technology, something on which there is surprisingly little data.

A recurring theme is the persistence of things we might consider to have been replaced by new technology, the horse, for example. It’s perhaps not surprising that a huge number of horses were used during the First World War but the German’s, the masters of the mechanised blitzkrieg, used 625,000 horses in 1941 when they invaded the Soviet Union. This isn’t the end of the story of animal power: Cuba, as a result of sanctions and the fall of the Soviet Union was using nearly 400,000 oxen by the end of the 1990s.

The same goes for battleships and military aircraft. When Britain and Argentina fought over the Falkland Islands in 1982, the Belgrano, originally commissioned into the US Navy in 1939 was sunk by 21-inch MK8 torpedoes originally designed in 1927! The Falklands airstrips were bombed from Britain by Vulcan bombers refuelled by Victor in-flight tankers, originally built in the 1950s. The reason for this is that the persistent technology actually does it’s job pretty well, the cost of replacing it for marginal benefit is too high and maintenance and repair means that to a degree these technological artefacts have been almost entirely rebuilt.

The time chapter expands on the idea that the introduction of technologies to different places is not simply a case of timeshifting, it depends on the local context. We find, for example, that horse draw carts are constructed from the parts of cars. And that corrugated iron and asbestos-cement are the material of choice for construction in the new slums of the developing world. Edgerton refers to these as ‘creole’ technologies – old technologies which have been repurposed into a new life.

In terms of technology and economic growth, it has really been mass production which has lead directly and obviously to economic growth particularly in the 30 years after the Second World War, known as the ‘long boom’. And whilst there was a boom in new technologies, all around the world the oldest technology – agriculture was also experiencing a boom in productivity – overshadowed by the new things.

As usual with such a book I picked up some useful facts to deploy at the dinner table:

  • The German V-2 rocket killed more people in its production than it did in its use.
  • The inventor of the Aga cooking range was a Nobel prize winning physicist.

For a scientist this book makes for an uncomfortable read in places since we come to the topic with some preconceived ideas and position, which are not necessarily grounded in the best of historical methods. For instance, Edgerton highlights that R&D spend just doesn’t correlate with economic growth. And that to a large degree the nation of invention is not the nation which benefits from an invention.

Perhaps most damning in the eyes of scientists, their bête noire, Simon Jenkins has supplied a cover quote:

The Shock of the Old is a book I can use. I can take it in two hands and bash it over the heads of every techno-nerd, computer geek and neophiliac futurologist I meet!

It’s a mistake to think of all scientists and computer geeks as being neophiliac. One of my colleagues works using an IBM Model M keyboard which we recently established was older than our intern, he also prefers the VIM editor – based on technology born in the 1970s. In the laboratory, the favoured computer language for scientific computation is still often FORTRAN, invented in the 1950s.

Thinking back over the other books I’ve read on the history of technology, for example A Computer Called LEO, Fire & Steam, The Subterranean Railway, Empire of the Clouds, The Idea Factory and The Backroom Boys. It is true to say they have very much focussed on single technologies or places but to my mind they have generally been pragmatic about the impact on society of their chosen subject. The authors have each had a definite passion for their topic leading to regret for what might have been: a thriving British aircraft industry, computer industry and so forth. But they don’t seem to provide the litany of dates and inventions of which Edgerton accuses them.

Despite this The Shock of the Old is readable, the author knows his field and provides a different viewpoint on the history of technology, more overarching, not so besotted. I’ll certainly be looking out for more of his books.

Visualising the London Underground with Tableau

This post was first published at ScraperWiki.

I’ve always thought of the London Underground as a sort of teleportation system. You enter a portal in one place, and with relatively little effort appeared at a portal in another place. Although in Star Trek our heroes entered a special room and stood well-separated on platforms, rather than packing themselves into metal tubes.

I read Christian Wolmar’s book, The Subterranean Railway about the history of the London Underground a while ago. At the time I wished for a visualisation for the growth of the network since the text description was a bit confusing. Fast forward a few months, and I find myself repeatedly in London wondering at the horror of the rush hour underground. How do I avoid being forced into some sort of human compression experiment?

Both of these questions can be answered with a little judicious visualisation!

First up, the history question. It turns out that other obsessives have already made a table containing a list of the opening dates for the London Underground. You can find it here, on wikipedia. These sortable tables are a little tricky to scrape, they can be copy-pasted into Excel but random blank rows appear. And the data used to control the sorting of the columns did confuse our Table Xtract tool, until I fixed it – just to solve my little problem! You can see the number of stations opened in each year in the chart below. It all started in 1863, electric trains were introduced in the very final years of the 19th century – leading to a burst of activity. Then things went quiet after the Second World War, when the car came to dominate transport.

Timeline2

Originally I had this chart coloured by underground line but this is rather misleading since the wikipedia table gives the line a station is currently on rather than the one it was originally built for. For example, Stanmore station opened in 1932 as part of the Metropolitan line, it was transferred to the Bakerloo line in 1939 and then to the Jubilee line in 1979. You can see the years in which lines opened here on wikipedia, where it becomes apparent that the name of an underground line is fluid.

So I have my station opening date data. How about station locations? Well, they too are available thanks to the work of folk at Openstreetmap, you can find that data here. Latitude-longitude coordinates are all very well but really we also need the connectivity, and what about Harry Beck’s iconic “circuit diagram” tube map? It turns out both of these issues can be addressed by digitizing station locations from the modern version of Beck’s map. I have to admit this was a slightly laborious process, I used ImageJ to manually extract coordinates.

I’ve shown the underground map coloured by the age of stations below.

Age map2

Deep reds for the oldest stations, on the Metropolitan and District lines built in the second half of the 19th century. Pale blue for middle aged stations, the Central line heading out to Epping and West Ruislip. And finally the most recent stations on the Jubilee line towards Canary Wharf and North Greenwich are a darker blue.

Next up is traffic, or how many people use the underground. The wikipedia page contains information on usage, in terms of millions of passengers per year in 2012 covering both entries and exits. I’ve shown this data below with traffic shown at individual stations by the thickness of the line.

Traffic

I rather like a “fat lines” presentation of the number of people using a station, the fatter the line at the station the more people going in and out. Of course some stations have multiple lines so get an unfair advantage. Correcting for this it turns out Canary Wharf is the busiest station on the underground, thankfully it’s built for it. Small above ground beneath it is a massive, cathedral-like space.

More data is available as a result of a Freedom of Information request (here) which gives data broken down by passenger action (boarding or alighting), underground line, direction of travel and time of day – broken down into fairly coarse chunks of the day. I use this data in the chart below to measure the “commuteriness” of each station. To do this I take the ratio of people boarding trains in the 7am-10am time slot with those boarding 4pm-7pm. For locations with lots of commuters, this will be a big number because lots of people get on the train to go to work in the morning but not many get on the train in the evening, that’s when everyone is getting off the train to go home.

CommuterRatios

By this measure the top five locations for “commuteriness” are:

  1. Pinner
  2. Ruislip Manor
  3. Elm Park
  4. Upminster Bridge
  5. Burnt Oak

It was difficult not to get sidetracked during this project, someone used the Freedom of Information Act to get the depths of all of the underground stations, so obviously I had to include that data too! The deepest underground station is Hampstead, in part because the station itself is at the top of a steep hill.

I’ve made all of this data into a Tableau visualisation which you can play with here. The interactive version shows you details of the stations as your cursor floats over them, allows you to select individual lines and change the data overlaid on the map including the depth and altitude data that.

Review of the year: 2013

Liverpool Metropolitan CathedralMy blogging is much reduced this year, at least on my own blog. This is a result of my new job with ScraperWiki and child care, Thomas is now nearly two years old.

I started the year with a couple of posts on my shiny new laptop; working for a startup I’ve escaped from the corporate Dell. One post was on the beast itself – a Sony VAIO, and Windows 8 – Microsoft’s somewhat confusing new operating system offering. The other post was on running Ubuntu on the VAIO. In the past this was a case of setting up dual boot but various innovations make this difficult and there is, in my view, a better solution: a virtual machine.

There wasn’t much ranting this year: I only managed one little one about higher education, and the reluctance amongst lecturers to take any teaching qualifications. The only other marginally opinion piece was on electronic books, where I muttered about DRM limiting the functionality of ebooks.

I managed to read a few books which ended up on my own blog: The Eighth Day of Creation, about the unravelling of the genetic code was a dense, heroic read. The Dinosaur Hunters was light and fluffy. Empire of the Clouds and The Backroom Boys were largely wistful rememberings of Britain’s former greatness in jet aeroplanes and in technology more generally. Chasing Venus and a History of the World in 12 Maps returned to the themes of geodesy and mapping which I’ve explored in the past. Finally, a bit of London history with The Subterranean Railway and Lucy Inglis’ Georgian London. I’ve been following Lucy on twitter since Georgian London was a twinkle in her eye. It’s difficult to choose a favourite amongst these, it’s either History of the World in 12 Maps or Georgian London.

Over on ScraperWiki’s blog I’ve been knocking out blog posts at a great rate, you can see them all here. I did a good deal of book reviewing over there too, my commute into work on the train means I get an hour or so of reading every day – which quickly adds up to a lot of reading! I read about machine learning, data visualisation (this and this), Tableau (this and this), natural language processing, R, Javascript and software engineering. I’m currently ploughing my way through Data Mining: Practical Machine Learning Tools and Techniques. I think my favourite of these was Natural Language Processing with Python. I’m beginning to see the value of the more expensive, better established publishing houses in terms of book quality.

Alongside this I did a few blog posts on new tools for my trade. I’ve long programmed to do scientific analysis but ScraperWiki is a company which sells software, and the discipline of writing software for others to use is different from writing software for yourself, particularly important are testing and source control.

I spoke at a couple of events: Data Science London, and Strata London where I gave an Ignite talk. Ignite talks follow a special format, they are five minutes long and you get 20 slides which advance automatically at the rate of one every 15 seconds – a somewhat frantic experience. My talk is captured on video.

I also did some bits of data analysis; #InspiringWomen was a look at a response to the online bullying and abuse of women. A place in the country was about data on house prices which we had collected for a campaign by Shelter.

Back on my own blog I managed to do a couple of photographic posts, one on Liverpool. The rail loop under Liverpool was closed which meant I had to walk across town to work, and I suddenly realised that Liverpool is rather spectacular architecturally. This led me on to getting the Pevsner Guide to Liverpool. The ScraperWiki office might be a bit unusual in that a quarter of the company owns this book! I also went on a business trip to Trento, which turns out to be a very attractive city, unfortunately I only had my phone with me to take photos.

The last year has highlighted to me what a privilege it was to have so much time to spend on my blogging, photography and garden shed fiddling in the past. It’s what got me my new job but for many, equally able, people this investment of time simply isn’t possible with the other responsibilities they have. Something to consider the next time you’re recruiting, and so highly rating that extra-curricular activity.

Also I realise I have a great deal of theoretical knowledge about a whole pile of technologies but I have spent rather less time on actually doing anything with them, so maybe this coming year there’ll be less reading and more coding on the train.

Happy New Year to you all!

Photographing Liverpool

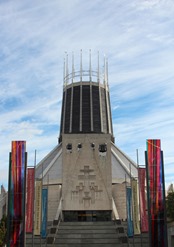
I’ve been working in Liverpool for a few months now, I take the Merseyrail train into Liverpool Central and then walk up the hill to ScraperWiki’s offices which are next door to the Liverpool Metropolitan Cathedral aka “Paddy’s Wigwam”.

Liverpool Metropolitan Cathedral

The cathedral was built in the 1960s, I rather like it. It looks to me like part of a set from a futuristic sci-fi film, maybe Gattacca or Equilibrium. Or some power collection or communication device, which in a way I suppose it is.

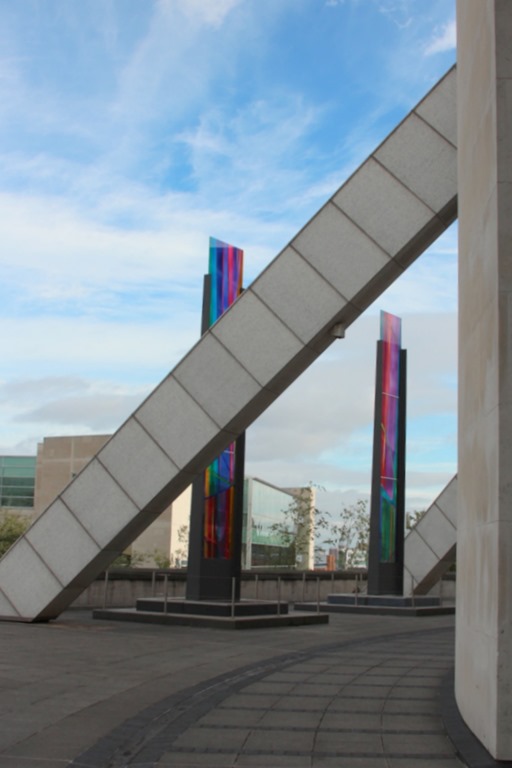
Liverpool Metropolitan Cathedral

To be honest the rest of my usual walk up the Brownlow Hill is coloured by a large, fugly carpark and a rather dodgy looking pub. However, these last few weeks the Merseyrail’s Liverpool Loop has been closed to re-lay track so I’ve walked across town from the James’ Street station, giving me the opportunity to admire some of Liverpool’s other architecture.

As an aside, it turns out that Merseyrail is the second oldest underground urban railway in the world, opening in 1886 and also originally running on steam power according to wikipedia, which seems to contradict Christian Wolmar in his book on the London Underground, which I recently reviewed. (Wolmar states the London Underground is the only one to have run on steam power.

Returning to architecture, I leave James’ Street station via the pedestrian exit on Water Street, there is a lift up onto James’ Street but I prefer the walk. As I come out there is a glimpse of the Royal Liver Building, on the waterfront.

Royal Liver Building

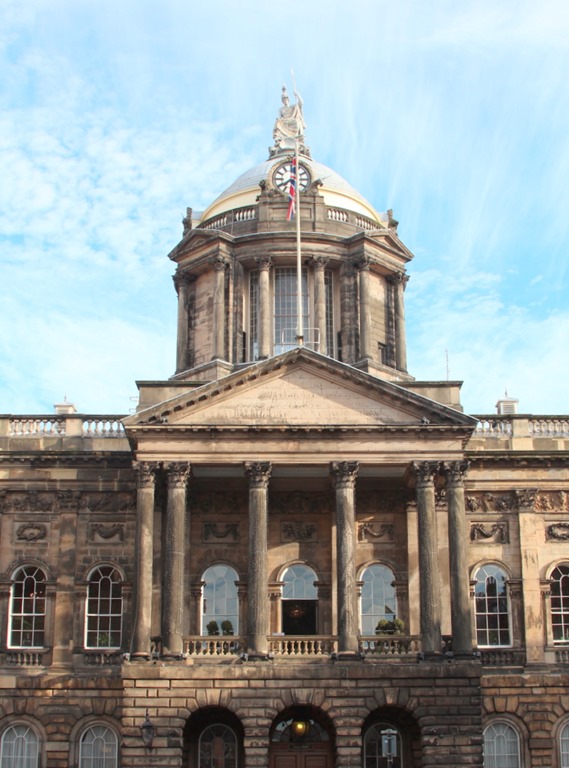
Just along the road is Liverpool Town Hall, for some reason it’s offset slightly from the centre of Castle Street which spoils the vista a little.

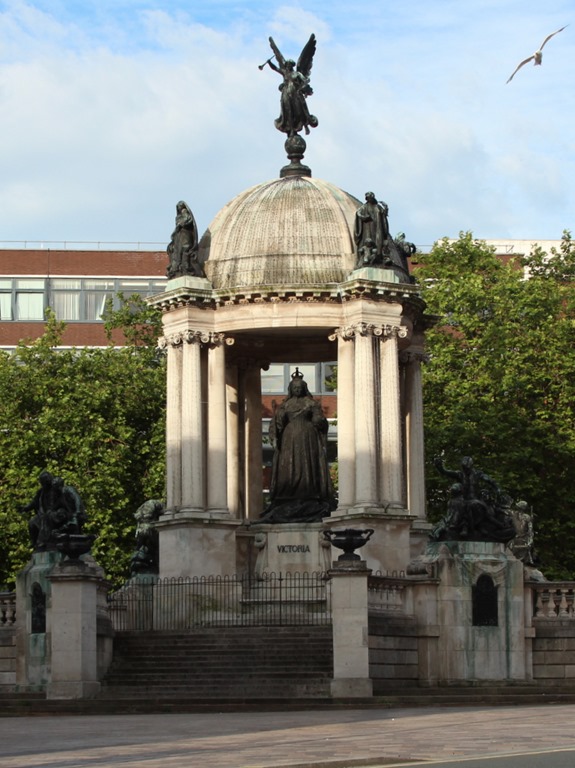
Liverpool Town HallDown at the other end of Castle Street we find the Queen Victoria Monument, she stands in Derby Square in front of the rather unattractive Queen Elizabeth II Law Courts.

Queen Victoria Monument

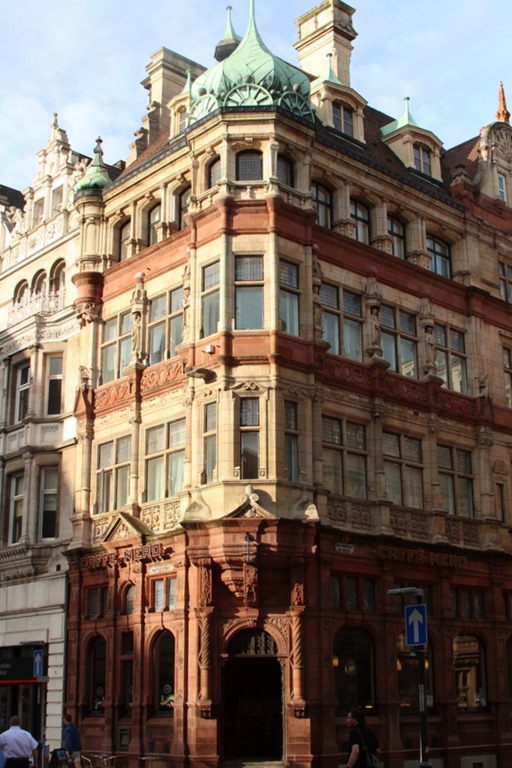
On the way I pass the former Adelphi Bank building, now a Cafe Nero. I like the exuberant decoration and the colour of the stone and domes.

Former Adelphi Bank


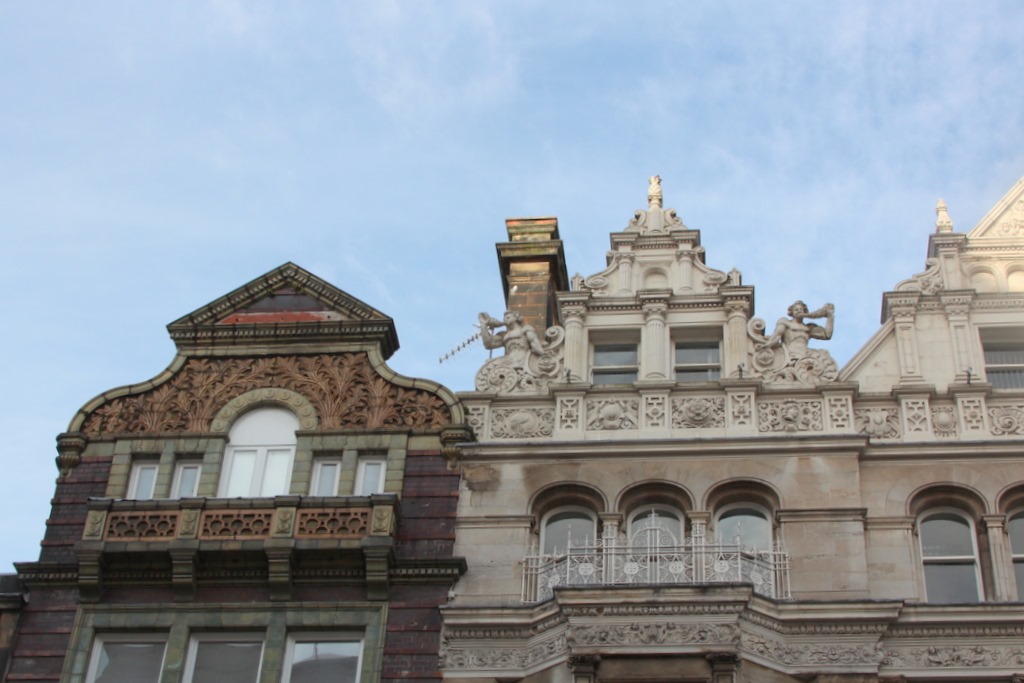
Raise your eyes from ground level and you see more decoration at the roof line of the buildings on Castle Street:

Buildings on Castle Street Once I’ve passed the Victoria Monument it’s a long straight walk down Lord Street then Church Street which has a mixture of buildings, many quite modern but some a bit older, often spoiled by the anachronistic shop fronts at street-level.

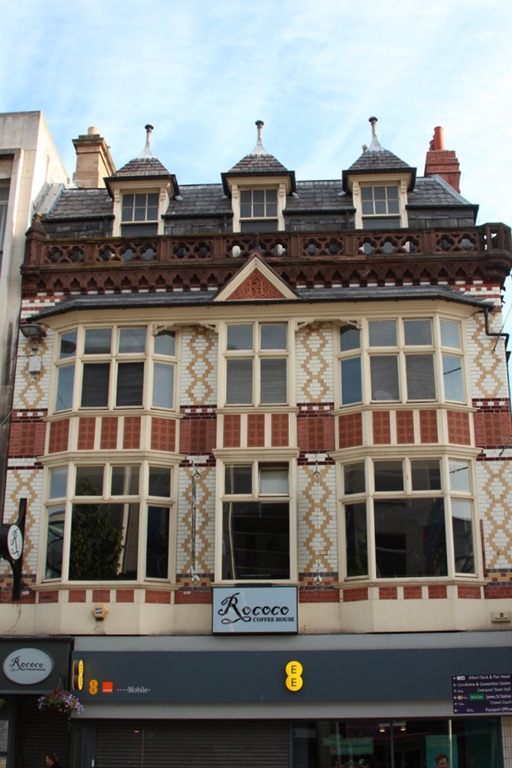
61 Lord Street

I quite like this one at 81-89 Lord Street but it’s seen better days, it used to look like this. It looks like it used to have a spectacular interior.

81-89 Lord Street


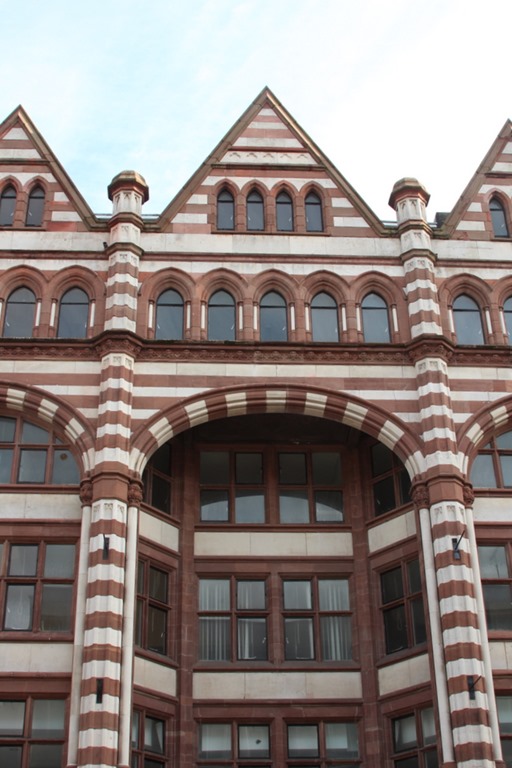
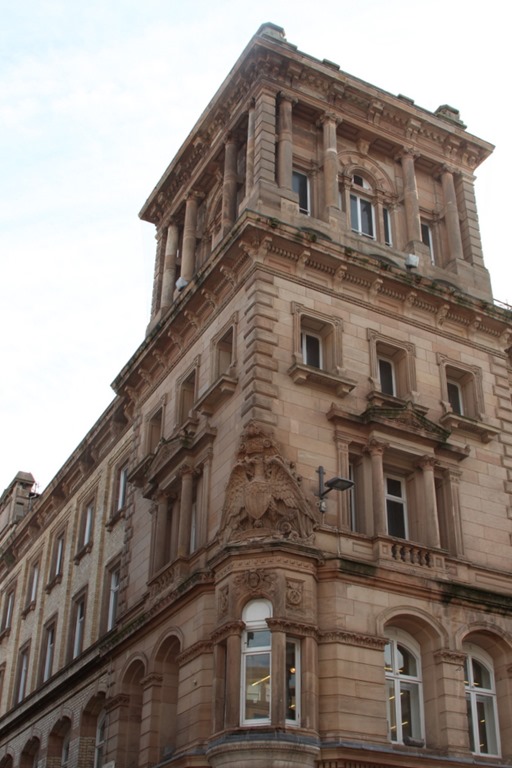
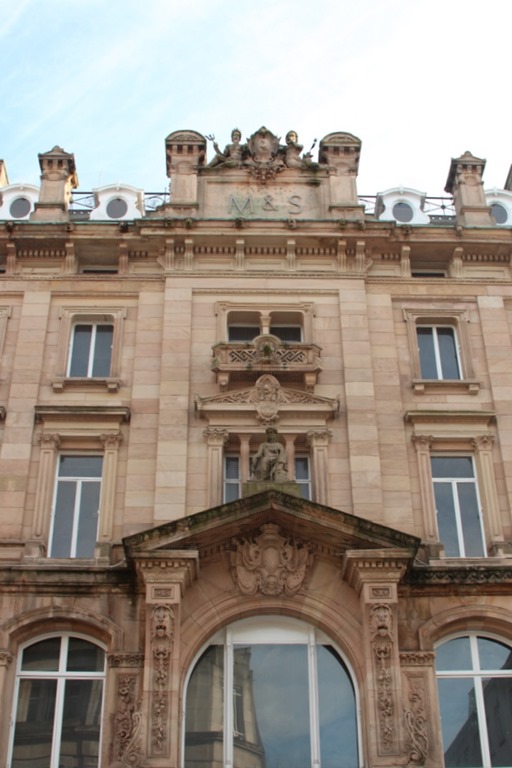
Further along, on Church Street, there is a large M&S in a fine building.

35 Church Street


35 Church Street


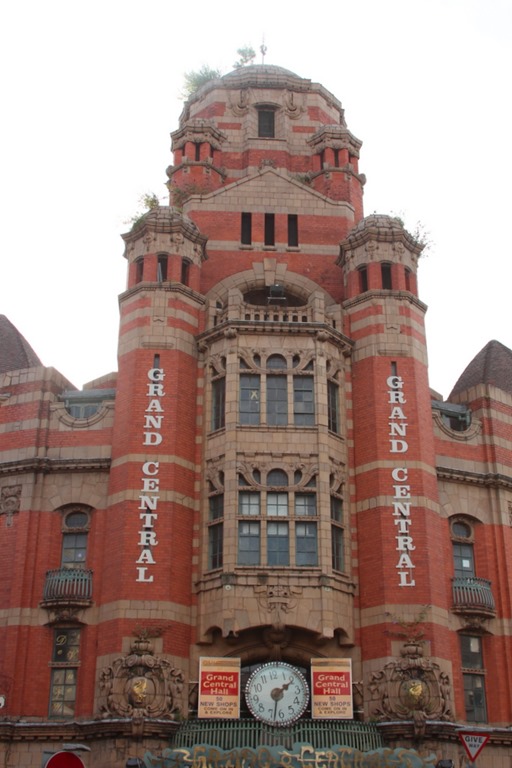
By now I’ve almost reached my normal route into work from Liverpool Central station, just around the corner on Renshaw Street is Grand Central Hall, which started life as a Methodist church.

Grand Central Hall

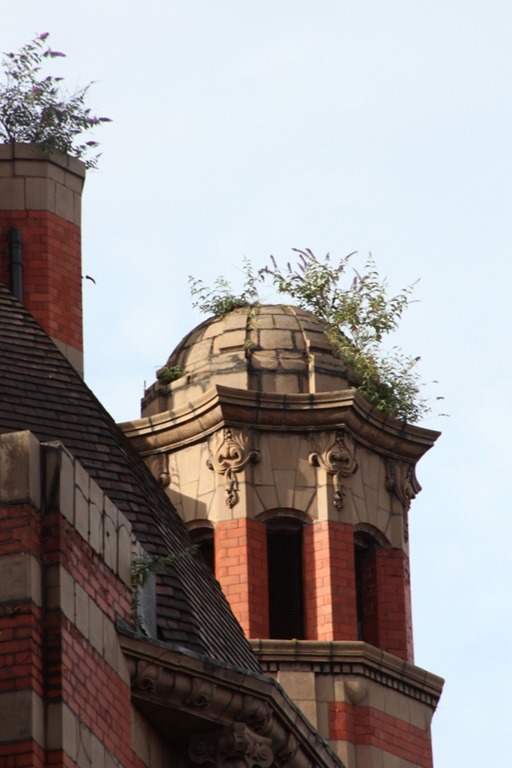
It’s a crazy looking building, the buddleia growing out of the roof make me think of one of J.G. Ballard’s novels.

Grand Central Hall

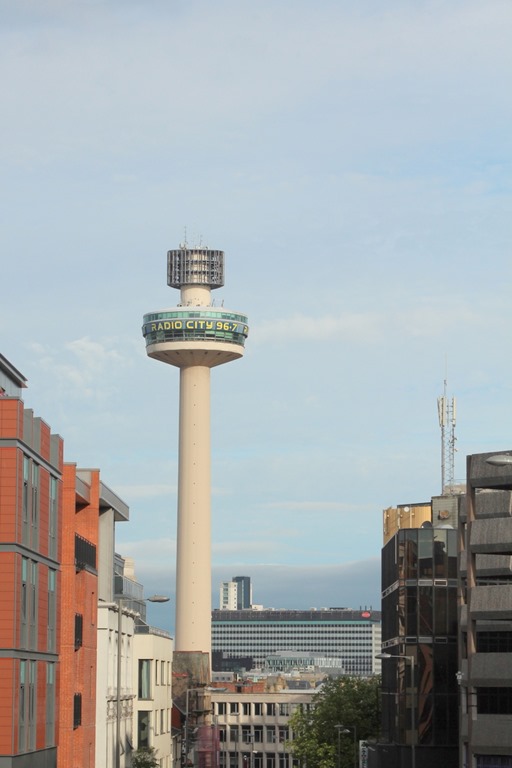
We’re on the final straight now, heading up Mount Pleasant towards the Metropolitan Cathedral. Looking back we can see the Radio City Tower, actually we can see the Radio City Tower from pretty much anywhere in Liverpool.

Radio City Tower

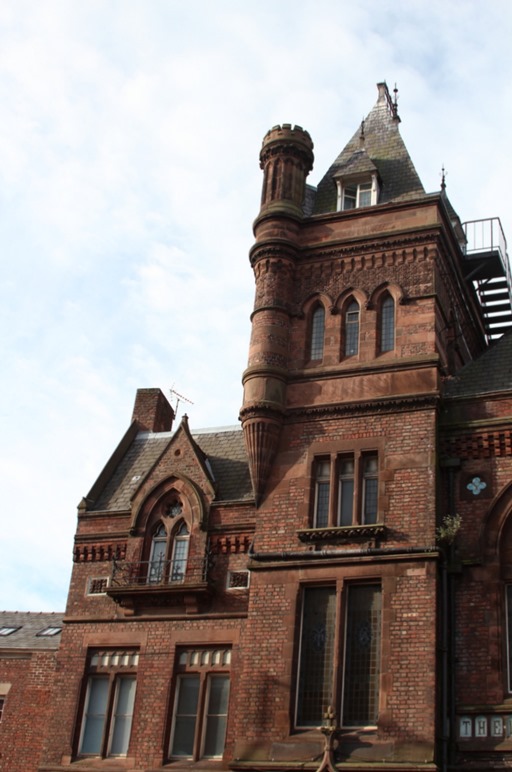
A little before we reach the Metropolitan Cathedral there is the YMCA on Mount Pleasant, another strange Victorian Gothic building.

YMCA Mount Pleasant

I struggled to get a reasonable photograph of this one, I was using my 28-135mm lens on a Canon 600D for this set of photos. This is a good walking around lens but for photos of buildings in dense city environments the 10-22mm lens is better for its ridiculously wide angle view – handy for taking pictures of all of a big building when you are standing next to it!

So maybe next week I’ll head out with the wide angle lens and apply some of the rectilinear correction I used on my Chester photographs.