This post was first published at ScraperWiki.
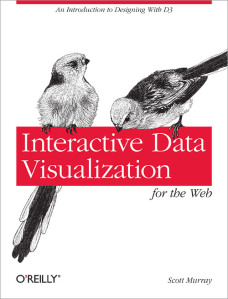
Next in my book reading, I turn to Interactive Data Visualisation for the web by Scott Murray (@alignedleft on twitter). This book covers the d3 JavaScript library for data visualisation, written by Mike Bostock who was also responsible for the Protovis library. If you’d like a taster of the book’s content, a number of the examples can also be found on the author’s website.
The book is largely aimed at web designers who are looking to include interactive data visualisations in their work. It includes some introductory material on JavaScript, HTML, and CSS, so has some value for programmers moving into web visualisation. I quite liked the repetition of this relatively basic material, and the conceptual introduction to the d3 library.
I found the book rather slow: on page 197 – approaching the final fifth of the book – we were still making a bar chart. A smaller effort was expended in that period on scatter graphs. As a data scientist, I expect to have several dozen plot types in that number of pages! This is something of which Scott warns us, though. d3 is a visualisation framework built for explanatory presentation (i.e. you know the story you want to tell) rather than being an exploratory tool (i.e. you want to find out about your data). To be clear: this “slowness” is not a fault of the book, rather a disjunction between the book and my expectations.
From a technical point of view, d3 works by binding data to elements in the DOM for a webpage. It’s possible to do this for any element type, but practically speaking only Scaleable Vector Graphics (SVG) elements make real sense. This restriction means that d3 will only work for more recent browsers. This may be a possible problem for those trapped in some corporate environments. The library contains a lot of helper functions for generating scales, loading up data, selecting and modifying elements, animation and so forth. d3 is low-level library; there is no PlotBarChart function.
Achieving the static effects demonstrated in this book using other tools such as R, Matlab, or Python would be a relatively straightforward task. The animations, transitions and interactivity would be more difficult to do. More widely, the d3 library supports the creation of hierarchical visualisations which I would struggle to create using other tools.
This book is quite a basic introduction, you can get a much better overview of what is possible with d3 by looking at the API documentation and the Gallery. Scott lists quite a few other resources including a wide range for the d3 library itself, systems built on d3, and alternatives for d3 if it were not the library you were looking for.
I can see myself using d3 in the future, perhaps not for building generic tools but for custom visualisations where the data is known and the aim is to best explain that data. Scott quotes Ben Schniederman on this regarding the structure of such visualisations:
overview first, zoom and filter, then details on demand


