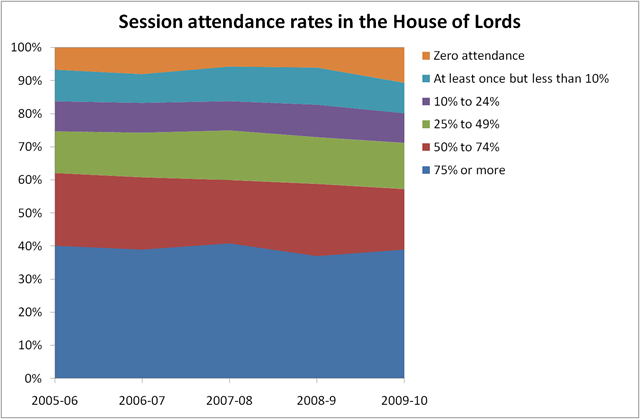
I know my readers love a chart, and today I found some data I thought was begging for a good graphing. It’s the attendance figures for the House of Lords found in a report entitled “Members Leaving the House” – found at the bottom of this article. The motivation for the report is to explore the idea of retirement for peers, something some peers are seeking regardless of any other changes taking place. A secondary motivation is that there is wider reform of the House of Lords proposed, and one of the issues is that the new House is envisaged, ultimately to have substantially fewer members – this type of discussion informs how that transition might be achieved.
The report contains a set of tables for the last five years indicating the fraction of sessions which peers attended broken down into groups:
- Attended 75% or more sessions
- 50% to 74%
- 25% to 49%
- 10% to 24%
- Attended at least once but less than 10%
- Zero attendance
This is what the data looks like:
To give some idea of scale: across the period shown here the total number of peers decreased from 777 to 741, the average number of sessions in a year was 140, this latter figure means that a peer attending “less than 10% of sessions” was attending less than twice. It compares with the number of working days in the year of approximately 240 (48*5 day weeks). Nearly 20% of peers attend a session in the House of Lords only once or twice a year.
Being a member of the House of Lords isn’t a proper job, it does not attract a salary, although peers may claim a subsistence and office allowance of up to £26,000 per year. In this sense we should not anticipate the levels of attendance achieved by those working “normally”. Some of the peers will be paid as government or opposition working peers. However, peers do have a direct effect on the laws the country makes and turning up twice a year (which is all 20% of them achieve) does suggest a fairly low degree of interest – if I did something twice a year I wouldn’t even consider it a hobby, I go to the dentist more often!


4 comments
3 pings
Skip to comment form
Fascinating.
It would be really interesting to see the voting rates, speaking rates, and speaking sensibly rates in similar graphs.
Some of that's possible using the data from http://www.theyworkforyou.com/ "speaking sensibly" is not amenable to machine analysis ;-) I'm not sure but there may be an API to their data.
so 20% of lords only turned up twice a year and claimed £26k in allowances?
Expenses claims are for *up to* £26k – the actual figures are published here: http://bit.ly/k4XFbd – I haven't looked through them.
[…] and other interests of members of the UK House of Lords. This follows on from earlier posts on the attendance rates of Lords, it turns out 20% of them only turn up twice a year. I also wrote a post on the […]
[…] to be done correctly, the scrutineers have to actually turn up? In a graph on another blog website (https://ianhopkinson.org.uk/2010/11/poor-attendance-record-in-the-house-of-lords/), it shows that only 40% of the Lords have attended over 75% of Lords meetings. Leaving an […]
[…] to be done correctly, the scrutineers have to actually turn up? In a graph on another blog website (https://ianhopkinson.org.uk/2010/11/poor-attendance-record-in-the-house-of-lords/), it shows that only 40% of the Lords have attended over 75% of Lords meetings. Leaving an […]